maSigPro: time course gene/isoform analysis

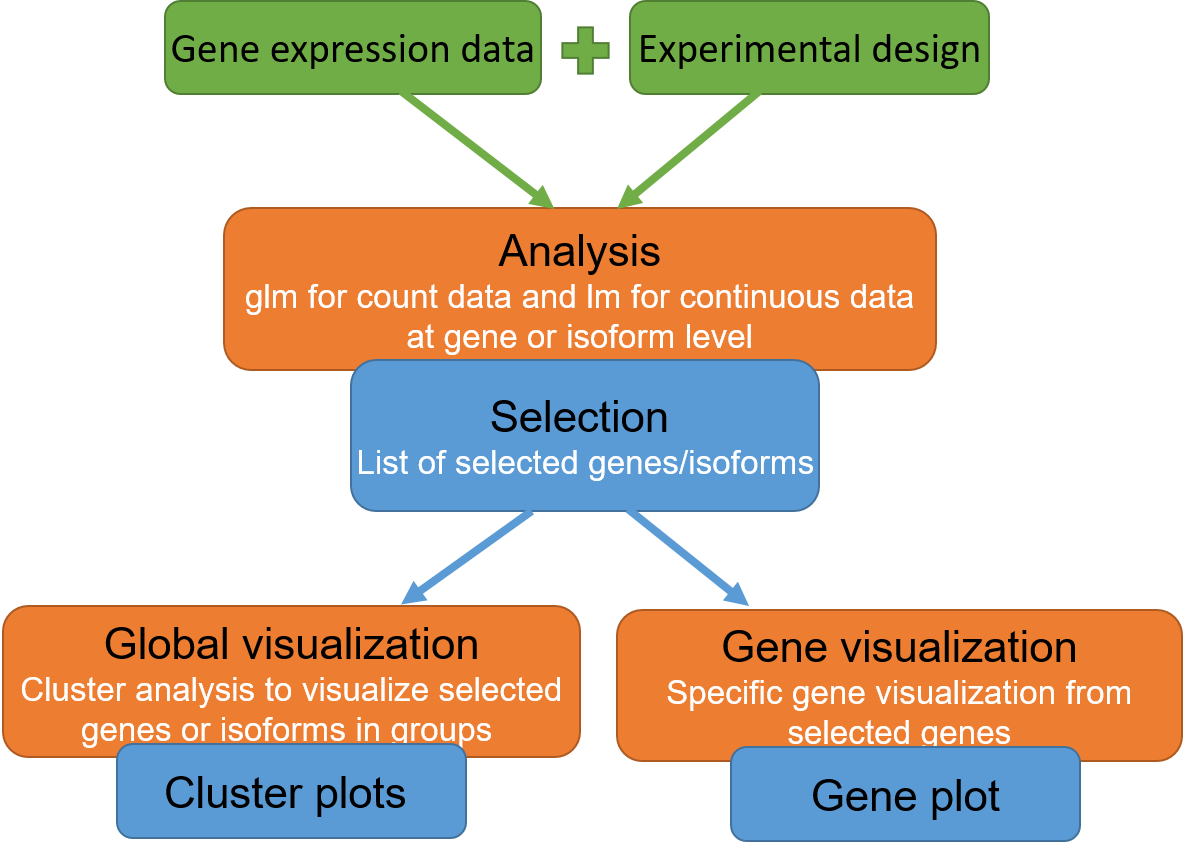
maSigPro is a web tool for the analysis of time course transcriptomics experiments. The analysis can be done to identify genes with statistically significant profiles through time and also genes with different trends for their isoforms.
Inputs
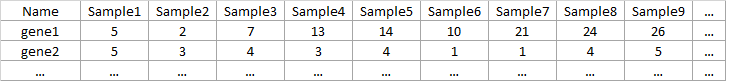
Data: txt file with genes in rows and samples in columns. First row/column must be names of samples/genes. Names should not start with a number and should also not contain strange characters.
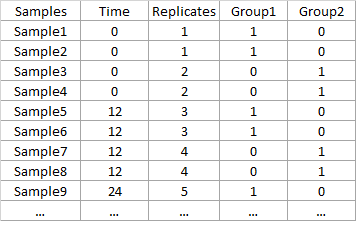
Design: txt file with the description of the experimental condition of each sample. Number of rows and names have to be equal to number and columns of the data-file. Columns of design file should be:
- Time with the time-points of each case.
- Replicates is a code to identify samples in the same experimental condition.
- A column for each experimental coding with 1 and 0 whether each sample belongs to that group or not.
Data are counts: If "Data are counts" is pick up, data are considered as counts, so glm models will be fitted.
Isoform analysis: If "Isoforms analysis" is pick up, the data is considered from isoforms. In this case first column of data file must have the name of the gene that each isoform belongs to.
Alpha: Required level for the significance of the models of each gene/isoform.
R-squared: Required level of the goodness of fit of the regression model. This parameter is between 0 and 1. Higher values indicate well fitted models. We recommend values between [0.4,0.8]. 0.7 is prefered for gene analysis and 0.4 for isoform analysis.
Clusters: Number of groups to split gene/isoform selection to show results.
More details about maSigPro package in: maSigProUsersGuide
RNA-seq example:
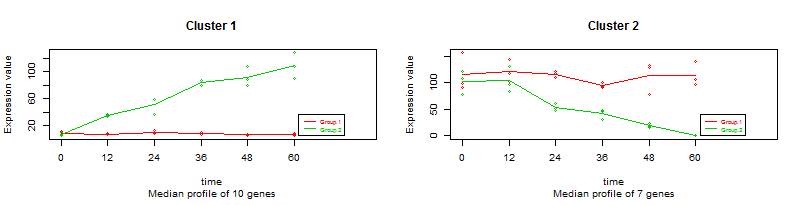
It is a subset of a bigger normalized and simulated dataset with 2 experimental groups, 6 time-points and 3 replicates. Simulation has been done by using a negative binomial distribution with theta paremeter = 5. The first 20 genes were simulated with changes among time. The analysis of this type of data is described in [1].
Data and design can be downloaded:
NBdata NBdesignSelecting the following items: Counts=TRUE, Isoforms=FALSE, alpha=0.05, R-squared=0.7, maSigPro selects 17 genes, that grouped in 2 clusters, global visualization gives this plot:
Microarrays example:
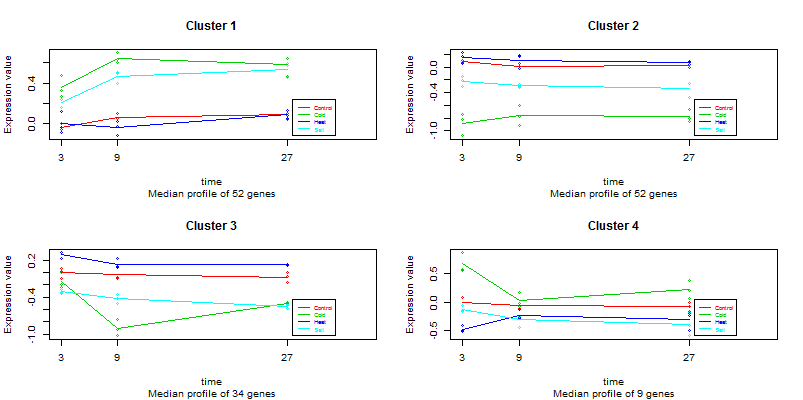
It is a public data set from a plant abiotic stress study performed at the TIGR Institute. In this study, potato plants were subjected to three different types of abiotic stresses and gene expression was monitored at three time points after the start of the treatments. RNA was also collected from non-stressed plants at the same time points and all samples where hybridased against a common control on a 11K cDNA potato chip. There are three biological replicates for each experimental condition. For speed in this example we will use a random 1000 genes data subset of this study. The original data can be found at http://www.tigr.org/tdb/potato/index.shtml The analysis of this type of data is described in [2].
abioticdata abioticdesignSelecting the following items: Counts=FALSE, Isoforms=FALSE, alpha=0.05, R-squared=0.7 and 4 clusters, we obtain in global visualization this plot:
Isoforms example:
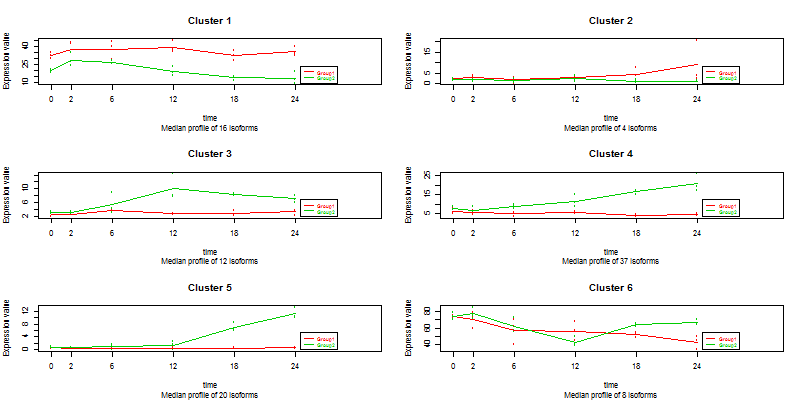
This is a subset of a public RNA-seq dataset (GEO accession GSE75417) describing a mouse six time points B-cell differentiation course triggered by the expression of the transcription factor Ikaros. It consists of 2782 isoforms (rows) belonging to 1009 genes. The experimental design is a 2 series experiment with 6 time points and three replicates per experimental condition. First column of ISOdata contains the name of the gene each isoform belongs to, while the remaining columns are the RNA-Seq data samples associated to the experimental conditions. The analysis of this type of data is described in [3].
ISOdata ISOdesignSelecting the following items: Counts=TRUE, Isoforms=FALSE, alpha=0.05, R-squared=0.4, gives 97 isoforms selected that can be gruped in 6 clusters.
References
[1] Nueda, MJ; Tarazona, S; Conesa, A. (2014) Next maSigPro: updating maSigPro Bioconductor package for RNA-Seq time series. Bioinformatics. 30, 2598-2602.
[2] Conesa, A.; Nueda, M.J.; Ferrer, A ; Talón, M. (2006) maSigPro: a method to identify significantly differential expression profiles in time-course microarray experiments. Bioinformatics. 22, 1096-1102.
[3] Nueda, MJ; Martorell, J; Martí, C; Tarazona, S; Conesa, A. (2018) Identification and visualization of differential isoform expression in RNA-seq time series. Bioinformatics. 34, 3, pp. 524 – 526.
Maintainer: Maria J. Nueda
![]()